The order slip rail
The kitchen is 95% busy. How much longer do you wait than at 50% busy?
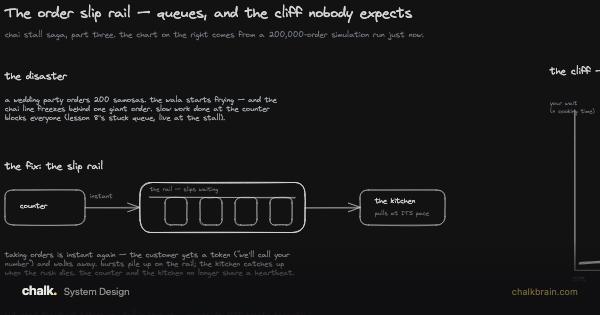
Orders come in at a counter, slips wait on a rail, and one kitchen cooks them in turn. The slider sets how busy that kitchen runs; watch the wait multiplier climb gently, then run away near the top. A second dial caps the rail, turning some orders away at the counter to keep the rest fast.
 Board: The Order Slip Rail →
On a narrow screen the rail's dots wrap to fit. The slider and the wedding-party button stack above it.
try this Drag How busy the kitchen runs to 99%, then set Turn orders away to 10 slips and watch the wait fall.
The counter
Taking an order never waits on the kitchen.
Instant
a token issued every time
The rail
3 slips waiting, on average.
Kitchen full. Come back at 5.
The kitchen
0.0% of orders turned away at the counter
The kitchen is 95% busy. How much longer do you wait than at 50% busy?
Getting expensive
The wait multiplier climbs faster than the busy percentage. Moving from comfortable to this band only moved the dial a little, but the wait has already doubled, then doubled again.
The tradeoff: Good utilization on paper. A bad ticket or a small burst now costs everyone behind it noticeably more.
Queues do not create capacity
They only smooth bursts. If orders arrive faster than the kitchen cooks, all day, no rail can help. You add cooks, or you say no. Everything on this page follows from that.
Saying no early
The second dial caps the rail. An order that arrives to find the rail full is refused at the counter, before anyone cooks for it. Every cap shortens the wait of the orders the kitchen does take, and every cap costs some orders. At 99% busy a cap of 10 slips turns about 8% away and serves the rest in under 5 cooking times instead of 99. Near the cliff the trade is cheap. At a calm 50%, a generous cap refuses almost nobody and changes almost nothing.
The cliff
The board's chart came from a 200,000-order simulation. This lab's formula is the analytic mean, Wq/S = ρ/(1-ρ).
| How busy | This lab (analytic mean) | The board's chart (simulated) |
|---|---|---|
| 50% | 1× | 1× |
| 80% | 4× | 4× |
| 90% | 9× | 9× |
| 95% | 19× | 20× |
| 99% | 99× | 150× |
Limits of this model
At 99% busy, this lab says 99× and the board's chart says 150×. Both are correct. Wq/S = ρ/(1-ρ) is the analytic mean wait, the average over infinite time. The board's number came from a single 200,000-order simulation. At the edge of saturation the queue has almost no ceiling. Most of the run looks calm, then one unlucky stretch produces an enormous wait. That pulls the average of a finite run well above the analytic mean. This is how a system behaves that close to full. Below about 95% the two agree closely, because the tail only grows once idle time nearly disappears.
The wedding-party burst uses a fluid model. It drains to exactly zero in a straight line. A real queue is less tidy: even a calm kitchen's rail bounces around, though it rarely gets long. Use the burst for its shape (a big pile drains slower the busier the kitchen already is). The exact number of orders at any instant is approximate.
The shed dial is the same closed-form queue with a rail that holds at most that many slips. A refused customer here simply leaves. A real one often retries straight away, which puts the refused load back on the counter. So a refusal should say when to come back.
One kitchen, one rail, one kind of order. A real system usually runs several workers in parallel and has priorities and retries. Its arrival rate is whatever shows up, and it changes minute to minute while the kitchen's own capacity changes too.
Sources
see also Large-scale cluster management at Google with Borg, Kafka: a Distributed Messaging System for Log Processing, Validity of the Single Processor Approach to Achieving Large Scale Computing Capabilities, The Tail at Scale and Efficient Memory Management for Large Language Model Serving with PagedAttention in Papers.