How Psychology Knows What It Knows
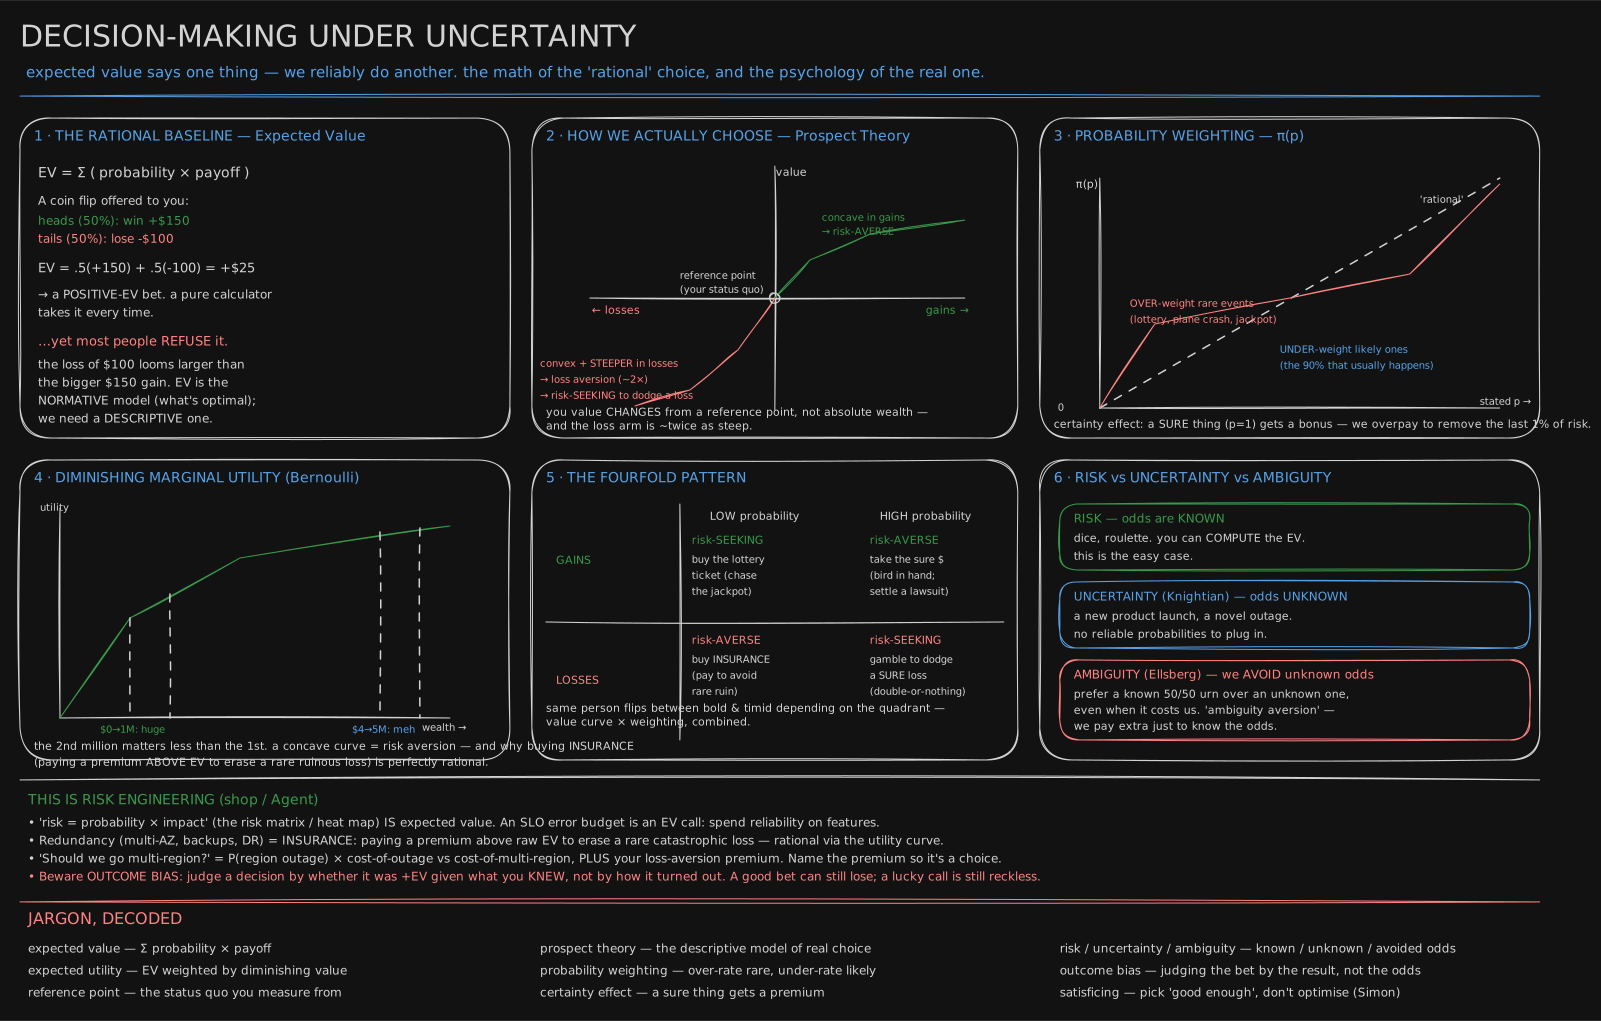
The board about weighing evidence you cannot be sure of. This lesson reads it from the other side: not how you should weigh a finding, but how the finding was made, and why a field full of honest people printed so many that later vanished.
Before you start. You need two things you already have: a rough feel for percentages, and the experience of hearing “studies show…” and wondering whether to believe it. Nothing else. Every later lesson in this track cites studies, and this one is the tool for checking them.
January 2011: a top journal prints proof that students can feel the future
On 5 January 2011 the New York Times ran a story about a paper that had not yet been published. Its author was Daryl Bem, a retired Cornell professor who studied how people behave in groups, and a respected one. The paper was headed for the Journal of Personality and Social Psychology, one of the most selective journals in the field. It reported nine experiments, run over about a decade, with more than 1,000 students. In eight of the nine, the students did slightly better than chance at sensing events that had not happened yet, a claimed power called precognition: which side of a screen a picture was about to appear on, which words they would be asked to practise after a memory test.
The paper had passed normal review. The journal’s editor, Charles Judd, told the Times that four reviewers had judged it met the journal’s standards. Nobody accused Bem of faking anything. He had used the same methods and the same standard of proof as everyone else in the field.
So there were only two possibilities. Either people can feel the future, or the field’s ordinary way of proving things could prove something false. Most psychologists did not believe in precognition, so the second option pointed at their own work. This lesson is the moves psychology uses to turn “I think” into “we know”, and the one that turned out to be broken.
Think of a study as a fishing trip: cast into murky water, report what came up. The question this whole lesson asks is how you tell a real fish from a boot.
Correlation: two things that rise together, and why that is not enough
The cheapest way to look for a fish is to watch two things move together. A made-up example: In a seaside town, on days when more ice cream is sold, more people get into trouble swimming. The two numbers rise and fall together. That pattern is called a correlation.
Nobody thinks ice cream causes drowning. Hot weather causes both. A hidden third thing that moves two numbers at once is the commonest way a correlation fools you, and in psychology the hidden thing is often family money, health or age.
The marshmallow test, from Motivation & Habit, is the famous case. Children who waited longer for a second treat in the late 1960s went on to higher test scores. That was a correlation. In 2018 Tyler Watts, Greg Duncan and Haonan Quan re-ran the idea with 918 children instead of fewer than a hundred. Waiting still predicted scores, but weakly, and the link mostly vanished once they accounted for the family the child grew up in.
flowchart TD
  H["Hidden third thing: a hot day, or a comfortable home"] --> A["Thing one rises: ice cream sold, or waiting longer"]
  H --> B["Thing two rises: swimmers in trouble, or test scores"]
  A -.->|"looks like a cause, is only a correlation"| B
A correlation tells you where to cast, not what you caught.
The control group: a coin decides who gets the pill
To know whether a pill lifts mood, you cannot just ask who chose to take it. People who choose pills differ from people who don’t. So you take the choice away. You gather volunteers and flip a coin for each one. Heads gets the pill. Tails gets an identical-looking dummy and becomes the control group.
A coin knows nothing about anyone’s family, health or mood, so on average the two groups start the same in every way, including ways nobody thought to measure. If the pill group ends up happier, the only thing that reliably differs between the groups is the pill. That turns “these two things go together” into “this one caused that one”.
flowchart LR
  V["100 volunteers"] --> C{"coin flip for each"}
  C -->|"heads, 50"| P["real pill"]
  C -->|"tails, 50"| D["dummy pill: the control group"]
  P --> M["measure mood"]
  D --> M
  M --> Q{"is the gap bigger than luck makes?"}
That last box is the hard part. Two groups of fifty never score exactly the same, even if the pill is chalk, so the question is how big a gap luck usually makes.
Statistical significance: the one-in-twenty allowance for luck
Psychology settled on a rule. Imagine the pill does nothing at all. How often would luck alone make a gap as big as the one you saw? Say the answer is 3 times in 100. That chance is the p-value, here p = .03. If it is under 5 in 100, written p < .05, the result is called statistically significant, and it counts as a fish.
Read that rule carefully, because it carries a built-in allowance. If the pill does nothing, one honest study in twenty will still cross the line by luck. One boot in twenty, mistaken for a fish, seemed a fair price.
The allowance only holds if you cast one line. And Bem’s paper, like a great many papers of its time, quietly cast several.
P-hacking: casting ten lines and reporting the one that bit
In 2011, the same year as Bem’s paper, three psychologists named Joseph Simmons, Leif Nelson and Uri Simonsohn published a paper called “False-Positive Psychology”. In it they ran an experiment designed to prove something impossible. Students listened either to the Beatles’ “When I’m Sixty-Four” or to a control song. Then the researchers checked the students’ birth dates. The Beatles group came out nearly a year and a half younger, an average of 20.1 years against 21.5, with p = .040. That clears the line.
Nobody’s age changed. The researchers had measured several things and tried several reasonable ways of analysing them, then reported the combination that crossed p < .05. Each choice was ordinary: which questions to count, when to stop collecting people. Each choice was another line in the water. Their computer simulations, which treated the choices as fully independent, showed that combining four of them pushed the chance of a false finding above 60%.
That practice is called p-hacking: trying several paths through the data and reporting the one that reached significance. It is usually not fraud, and most people doing it never notice. Ten lines means about four chances in ten of a boot that looks like a fish.
flowchart LR
  N["a pill that does nothing"] --> L1["line 1: mood, p = .31"]
  N --> L2["line 2: sleep, p = .62"]
  N --> L3["line 3: memory, p = .04"]
  N --> L4["lines 4 to 10: nothing"]
  L3 -->|"only this one gets written up"| R["published finding"]
The p-values in the picture are made up; the pattern is not. The reader sees one line and cannot know nine more were cast.
Replication: fishing the same water again, with the plan written down
The fix is the oldest idea in science. If the fish is real, it is still there when someone else casts in the same spot. Running the same study again, ideally with more people and with the analysis written down in advance, is called replication.
In March 2012 Stuart Ritchie, Richard Wiseman and Christopher French published three careful repeats of one of Bem’s experiments, with 150 students in all. They found nothing. Then the field turned the tool on itself. In August 2015 a group calling itself the Open Science Collaboration published repeats of 100 psychology studies. In the originals, 97% had been significant. In the repeats, 36% were. The average gap between groups in the repeats was about half the size of the original’s.
Ego depletion, the idea that willpower runs down like a battery, was repeated in 23 labs at once in 2016 and came out at roughly zero. Power posing, standing like a superhero to change your body’s chemical messengers, failed a larger repeat in 2015. In 2016 one of its original authors, Dana Carney, said publicly that she no longer believed the effect was real. That episode is now called the replication crisis, and it is why every study in this track carries a note on whether it held up.
You now know
- Two things that rise and fall together are only correlated; a hidden third thing can move both.
- A control group chosen by coin flip is what lets an experiment say “this caused that”, because a coin cannot favour anyone.
- “Statistically significant” (p < .05) means luck alone would produce a result this big only about one time in twenty, if only one thing was tested.
- Testing many things and reporting the one that worked, often without meaning to, raises that one-in-twenty to four in ten or worse.
- A finding is trustworthy when someone else repeats it with the plan written down first; a large share of famous psychology findings shrank or vanished when that was done.
Stop here if you want. What follows is the same fishing trip in numbers: how fast false findings stack up, why small studies print big effects, and how the claims in this track’s other lessons stand today.
Second read: the arithmetic of the crisis
How fast the false findings stack up. If the pill does nothing, each honest test has a 0.95 chance of correctly finding nothing. Ten independent tests all come up empty with chance 0.95¹⁰ = 0.599, so at least one fluke turns up with chance 1 − 0.599 = 0.401.
In plain words: ten looks at nothing find something four times in ten.
The script below runs 1,000 simulated labs at each setting. The pill does nothing in every lab. The labs, the pill and the counts are all simulated; the seed is fixed so the output is the same every run:
 1 outcomes:  37 of 1000 labs "find" it   (arithmetic: 5.0%)
 3 outcomes: 149 of 1000 labs "find" it   (arithmetic: 14.3%)
 5 outcomes: 233 of 1000 labs "find" it   (arithmetic: 22.6%)
10 outcomes: 399 of 1000 labs "find" it   (arithmetic: 40.1%)
20 outcomes: 620 of 1000 labs "find" it   (arithmetic: 64.2%)
The simulated counts wobble two or three points around the arithmetic (37 instead of 50 at one outcome) because a thousand labs is a sample. Real outcomes in a study are often related, sleep and mood move together, so real inflation is somewhat smaller than this independent-outcome version. Simmons, Nelson and Simonsohn’s simulations of four realistic choices landed above 60%.
Effect size: how big, not just whether. Significance says a gap is probably not luck. It says nothing about whether the gap matters. Psychologists measure size with Cohen’s d: the gap between the two groups’ averages, divided by how spread out people are within a group.
d = (average of pill group − average of control group) ÷ spread within a groupIn plain words: d = 0.2 means the groups differ by a fifth of the normal person-to-person spread, which is small; d = 0.8 is large. Ego depletion’s 23-lab repeat (Hagger and colleagues, 2,141 people, Perspectives on Psychological Science, 2016) came out at d = 0.04, with a 95% range of −0.07 to 0.15 that includes zero.
Why small studies print big effects. Suppose an effect is real but small, d = 0.2, and labs test it with too few people. Most labs miss it. The few that cross p < .05 are the ones luck pushed upward, and only those get printed. The second script simulates 2,000 labs per sample size (a teaching setup, not real studies):
n= 20 per group:  198 of 2000 printed, printed effect averages d = 0.70 (true 0.20)
n= 50 per group:  315 of 2000 printed, printed effect averages d = 0.50 (true 0.20)
n=200 per group: 1051 of 2000 printed, printed effect averages d = 0.28 (true 0.20)
n=800 per group: 1958 of 2000 printed, printed effect averages d = 0.20 (true 0.20)
At 20 people a group, the printed effect is three and a half times the truth. This filter is one reason the 2015 repeats found effects about half the original size: the originals were the lucky casts. It also explains why a small, striking, much-cited study is the kind most likely to shrink.
The two fixes, and what each costs. One fix is to raise the bar for every extra test: with ten outcomes, demand p < .005 each (the Bonferroni correction). That holds false findings near 5%, and it also misses real effects more often. The other fix is to write down, before collecting data, the one outcome and analysis that will count, and post it publicly: preregistration. Other results can still be reported, labelled as exploratory. A journal can go further and accept the paper before the results exist, a format called a Registered Report, so a null result gets printed too. The lab the forking paths lets you move the number of outcomes and switch between the three rules on the same thousand labs.
How this track’s own claims stand. Every lesson in this track leans on studies. Here is how the ones most often repeated in popular writing look today, as far as this lesson’s sources show:
| Claim | Where in this track | Status |
|---|---|---|
| Dopamine signals reward prediction error | Motivation & Habit | Holds; Schultz’s 1997 result has been reproduced across many labs and species |
| The marshmallow test predicts life outcomes | 0090 | Shrank: 918 children in 2018, link mostly gone after family background |
| 10,000 hours of practice makes an expert | Learning & Expertise | Shrank: across 88 studies practice explained about 12% of performance (Macnamara, Hambrick and Oswald, 2014); a 2019 redo of the violin study found 26%, not the original’s much larger share |
| Ego depletion, willpower as a battery | (Personal Development) | Failed a 23-lab repeat, 2016 |
| Power posing changes hormones | none | Failed a 2015 repeat; an original author withdrew support in 2016 |
| Flow | Attention & Cognitive Load | Rests mainly on people’s own reports of how an activity felt; read it as a description, not a tested cause |
Where the field came from, in one paragraph. Wilhelm Wundt opened a laboratory in Leipzig in 1879 devoted to psychological experiments, which is the usual birthday given for the science. In 1913 John B. Watson’s paper “Psychology as the Behaviorist Views It” argued the field should measure only what people do, not what they report thinking, and behaviourism ran American psychology for decades. From the 1950s the cognitive approach brought the inner workings back, as information being stored and processed, which is the view most of this track uses. Brain imaging and neuroscience later added a physical layer, which The Wet Hardware covers. Each shift changed what the field was allowed to measure. The replication crisis changed how it checks.
Try it
The scripts need Node.js (nodejs.org, any recent version); no Node? Paste the code into your browser’s developer console instead.
- Run the fishing trip. Save as
forks.mjsand runnode forks.mjs. It prints the first table above.
// A pill that does nothing, tested by 1,000 labs. Each lab measures k outcomes
// and reports the study as a "finding" if ANY outcome reaches p < .05.
let seed = 42;                                   // fixed seed: same output every run
const rand = () => ((seed = (Math.imul(seed, 1664525) + 1013904223) >>> 0) + 0.5) / 2 ** 32;
const normal = () => Math.sqrt(-2 * Math.log(rand())) * Math.cos(2 * Math.PI * rand());

for (const k of [1, 3, 5, 10, 20]) {
  let found = 0;
  for (let lab = 0; lab < 1000; lab++) {
    let any = false;
    for (let j = 0; j < k; j++) if (Math.abs(normal()) > 1.96) any = true;  // |z| > 1.96 is p < .05
    if (any) found++;
  }
  const maths = (1 - 0.95 ** k) * 100;
  console.log(`${String(k).padStart(2)} outcomes: ${String(found).padStart(3)} of 1000 labs "find" it   (arithmetic: ${maths.toFixed(1)}%)`);
}
Change seed = 42 to any other number and the counts move a little while the arithmetic column stays put. That is the difference between a sample and the truth it estimates.
- Watch small studies exaggerate. Save as
curse.mjsand runnode curse.mjs. It prints the second table.
// A real but small effect (d = 0.2). 2,000 labs each test it with n people per group.
// Journals print only the labs that reach p < .05. What size does the printed effect look like?
let seed = 7;
const rand = () => ((seed = (Math.imul(seed, 1664525) + 1013904223) >>> 0) + 0.5) / 2 ** 32;
const normal = () => Math.sqrt(-2 * Math.log(rand())) * Math.cos(2 * Math.PI * rand());

const trueD = 0.2;
for (const n of [20, 50, 200, 800]) {
  const se = Math.sqrt(2 / n);                   // standard error of d, two groups of n
  let printed = 0, sum = 0;
  for (let lab = 0; lab < 2000; lab++) {
    const d = trueD + se * normal();             // what this lab measures
    if (Math.abs(d / se) > 1.96) { printed++; sum += d; }
  }
  console.log(`n=${String(n).padStart(3)} per group: ${String(printed).padStart(4)} of 2000 printed, printed effect averages d = ${(sum / printed).toFixed(2)} (true 0.20)`);
}- Correlation or experiment? For each headline, decide whether the study behind it could show a cause. Answers are in the note.
- “People who meditate report less stress.”
- “Volunteers randomly assigned to an 8-week meditation course reported less stress than a waiting-list group.”
- “Countries that eat more chocolate win more Nobel prizes.”
- “Students given a practice quiz, chosen by lottery, scored higher a week later than students who reread.”
- “Teenagers who sleep more get better grades.”
Answers
1, 3 and 5 are correlations: the people (or countries) chose their own condition, so a hidden third thing (free time, wealth, a calmer household) could drive both numbers. 2 and 4 are experiments: a coin or lottery decided who got what, so the groups started equal on average. The waiting-list group in 2 is the control group.
-
Check one claim yourself. Pick a psychology claim you have heard repeated, the kind that appears in self-help books. Find the original study. Write down three numbers: how many people it tested, its effect size if given, and whether anyone has repeated it. Most claims fail at the third question, which is itself an answer.
-
Run a preregistered experiment on yourself. Take 40 words in a language you are learning. Before you start, write down in a dated note: half will be studied in one block on day one, half spread over four short sessions across a week; the outcome is how many of each half you recall on day 14; the prediction is that the spread half wins. Then run it and report the result even if it disappoints. One person proves little, as this lesson showed, but writing the plan down first is the habit that matters. Spaced Repetition explains what you should expect.
Go deeper
- Bem (2011), “Feeling the Future”, Journal of Personality and Social Psychology 100(3); Carey, “Journal’s Paper on ESP Expected to Prompt Outrage”, New York Times, 5 January 2011.
- Ritchie, Wiseman & French (2012), “Failing the Future”, PLoS ONE.
- Simmons, Nelson & Simonsohn (2011), “False-Positive Psychology”, Psychological Science.
- Open Science Collaboration (2015), “Estimating the reproducibility of psychological science”, Science.
- Hagger et al. (2016), “A multilab preregistered replication of the ego-depletion effect”, Perspectives on Psychological Science.
- Watts, Duncan & Quan (2018), “Revisiting the Marshmallow Test”, Psychological Science.
- Macnamara, Hambrick & Oswald (2014), “Deliberate practice and performance in music, games, sports, education, and professions”, Psychological Science.
Related
- The Wet Hardware is the next lesson: the physical brain this track keeps naming.
- Decision-Making Under Uncertainty is the board this lesson borrows, read from the evidence-weighing side; base rates there are the same kind of trap as small studies here.
- Cognitive Biases is why researchers p-hack without noticing: confirmation bias works on scientists too.
- The 99 Percent Test That Is Usually Wrong (Mind Blown) is the same arithmetic with a medical test instead of a lab: a rare true thing is easily outnumbered by false alarms.
- The Less You Know, the More Sure You Feel (Mind Blown) is a much-quoted finding; try this lesson’s three questions on it: how many people, how big, and has anyone repeated it.
- Energy, Goals & Recovery (manage energy, not time) (Personal Development) is where ego depletion’s failed replication comes up from the practical side.
- How to Read a Self-Help Claim (effect sizes, replication, and testing it on yourself) (Personal Development) turns this lesson into a five-question check you can run on any self-help claim.
Hint
Think about who chooses to take a pill, and who decides when a coin does.
Hint
Ask which of many small studies makes it into a journal.
Retrieval practice
8 questions. Answer each one before you open it.
Why was Bem’s 2011 paper a problem for psychology even for people who did not believe in precognition?
It used the field’s standard methods and passed normal peer review with four reviewers. If those methods could prove something almost nobody believed, they could prove other false things too, so the problem was the method, not Bem.
What makes a control group chosen by coin flip able to show cause, when a correlation cannot?
A coin knows nothing about anyone, so on average the two groups start equal in every way, including hidden ones like family money or health. Any later difference is then down to the treatment, not to a third thing driving both.
What does p < .05 actually promise, and when does that promise break?
That if the effect were zero, luck alone would produce a result this extreme about one time in twenty. It holds for one planned test. It breaks when many outcomes or analyses are tried and only the significant one is reported.
A pill does nothing. A lab measures 10 independent outcomes and reports any that reach p < .05. Roughly how often does it “find” something, and how is that computed?
About 40% of the time. All ten tests come up empty with chance 0.95¹⁰ ≈ 0.60, so at least one fluke appears with chance 1 − 0.60 = 0.40.
What did the 2015 Open Science Collaboration find when it repeated 100 psychology studies?
97% of the originals had been significant; 36% of the repeats were, and the repeats’ effects averaged about half the original size.
Why do small studies tend to print exaggerated effects, even when nobody p-hacks?
With few people, only the labs that luck pushed upward cross p < .05, and only those get printed. In the simulation with a true d = 0.2 and 20 people per group, the printed effects averaged d = 0.70.
Name the two fixes for testing many outcomes and the cost of each.
Raise the bar for every extra test (Bonferroni): false findings stay near 5%, but real effects are missed more often. Write the one outcome down first and post it (preregistration): both false findings and real catches stay honest, but surprises on other outcomes can only be reported as exploratory.
How do the marshmallow test and the 10,000-hour rule stand today?
Both shrank. The 2018 repeat with 918 children found waiting only weakly predicted later scores, and the link mostly disappeared once family background was accounted for. Across 88 studies, practice explained about 12% of performance differences, and a 2019 redo of the original violin study found 26%, far from “practice explains it all”.