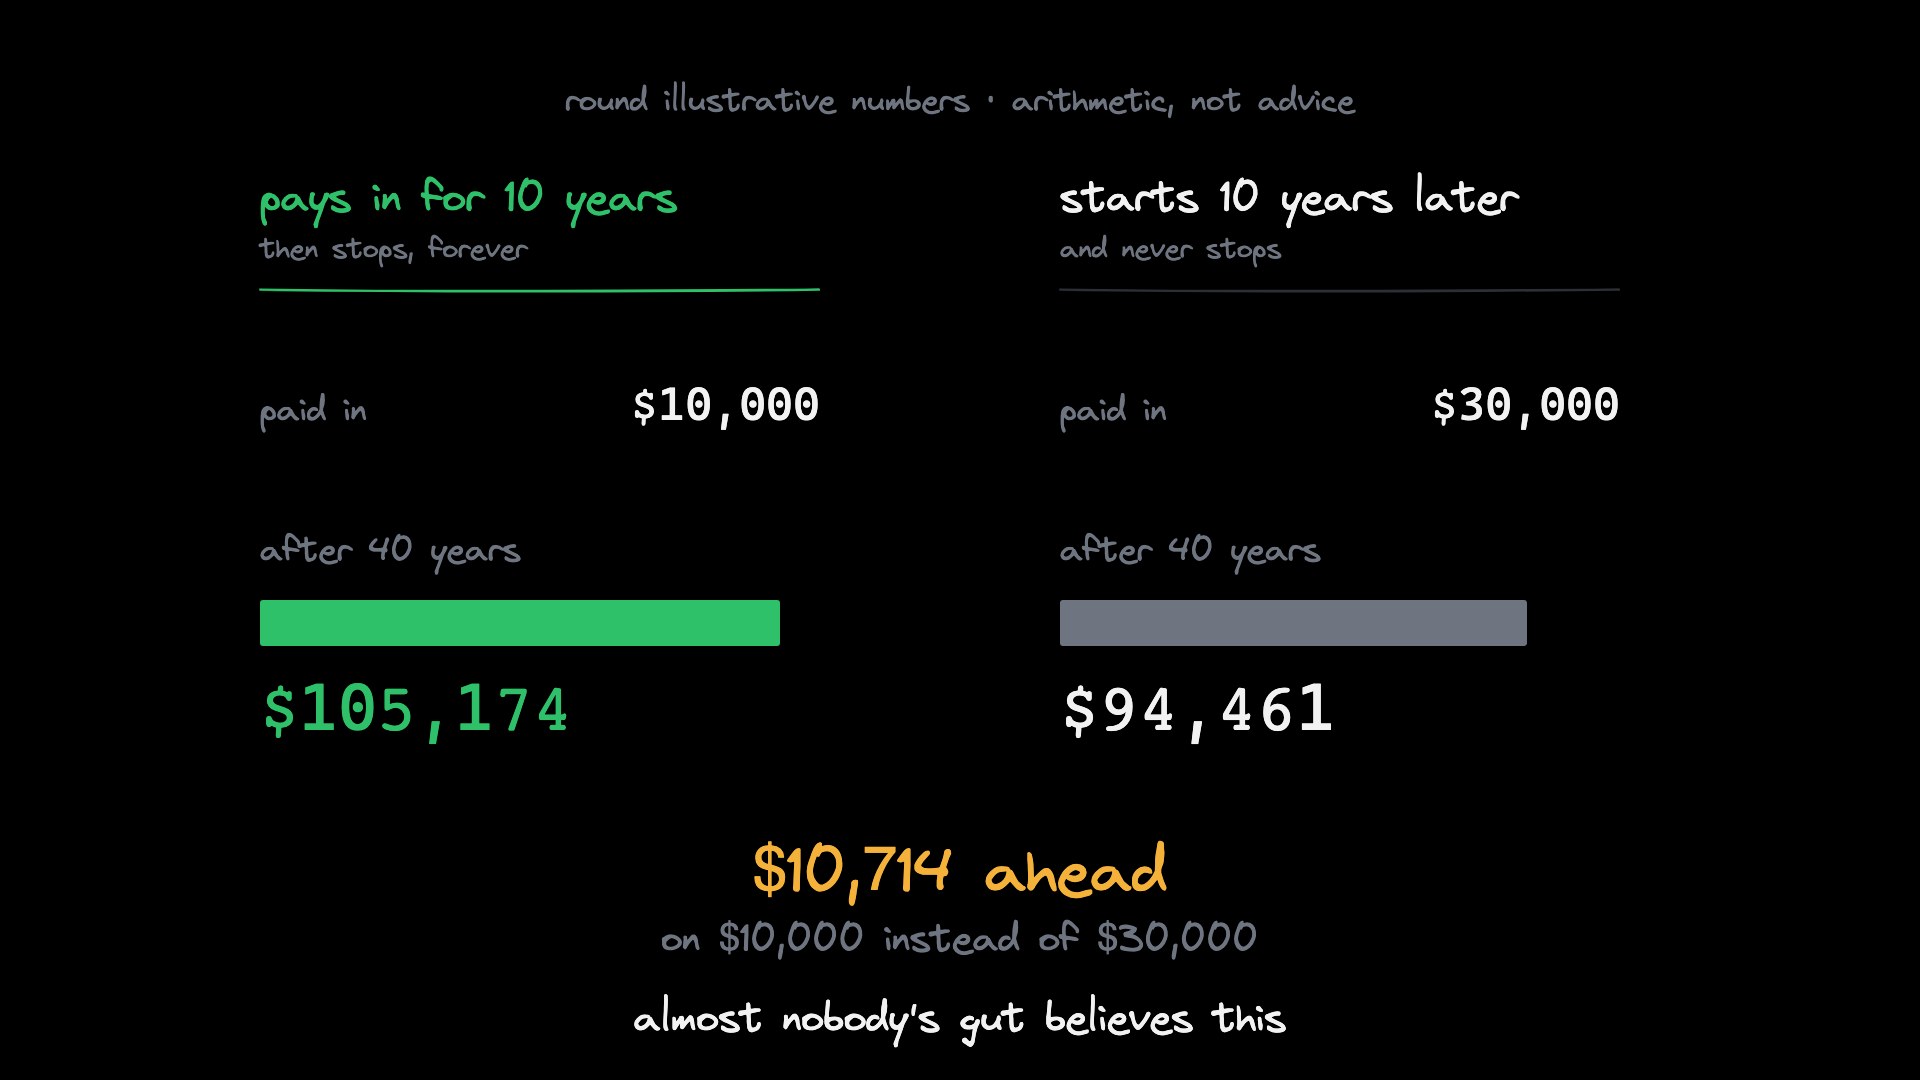
Compound Interest, the 8th Wonder
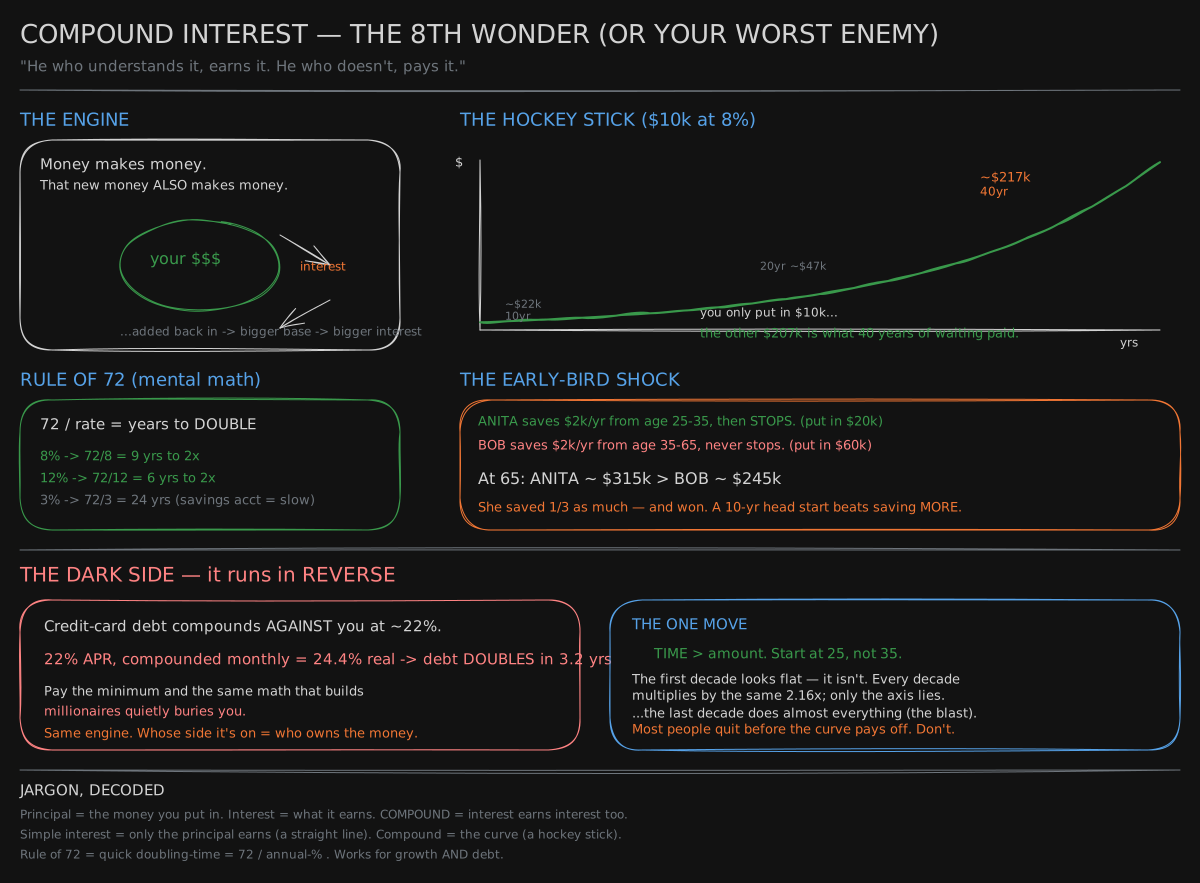
The board draws the hockey-stick curve of a number doubling and the Rule of 72, and both are correct. This lesson is about the part a curve can’t show: what a “rate” secretly turns into once it’s real money.
Before you start. You need to be able to multiply and read a percentage as “this fraction of.” Fold a Paper to the Moon already showed you the fun part, that a number which doubles again and again gets absurdly large; this note is about what changes once that number is money that can be taxed, skimmed, and pulled out at the wrong moment.
1683: a loan that should have run away to infinity
Jacob Bernoulli was a mathematician working in Basel, and in 1683 he sat with a question about a loan. Say a dollar earns 100% interest a year, credited once, at the end of the year. It becomes two dollars. Simple.
Now credit that same 100% twice a year instead, half at midyear and half at year end. Half a dollar grows the account to $1.50 by midyear, and that new total earns the second half’s interest too, so the dollar ends the year at $2.25. Credit it four times a year and it ends at $2.44. Credit it daily, 365 times, and it ends at $2.71.
Bernoulli expected that crediting the interest more and more often, forever, would send the dollar to infinity. It does not. Each time you credit more often, the extra interest per credit gets smaller, by just enough to cancel out the extra credits. The two effects fight to a standstill. Bernoulli proved the dollar could never quite reach three, and could never quite stop climbing either: it creeps up on a wall. That wall has a name today, the number e, and it sits at 2.71828… A mathematical constant, discovered while somebody was doing arithmetic on a loan.
flowchart LR
  A["1 time a year: $2.00"] --> B["2 times a year: $2.25"]
  B --> C["4 times a year: $2.44"]
  C --> D["365 times a year: $2.71"]
  D --> W["compounded forever: still $2.72 -- a wall, not infinity"]
The rate you’re quoted is not the rate you get
That wall is the reason a stated interest rate is never one number. “8% a year” does not say how often the 8% is credited, and how often changes what you actually earn, the same way Bernoulli’s dollar changed with how often it was credited. Credit 8% once a year and you get exactly 8%. Credit it every month and each month adds two-thirds of a percent, on a balance that already includes the earlier months’ interest, so the year ends at 8.30%. Credit it every instant, the way Bernoulli’s wall works, and the ceiling is 8.33%. The whole gap between “once a year” and “every instant, forever” is a third of one percentage point.
The number you actually earn, once the crediting frequency is counted for, is the effective rate. A third of a point sounds like a rounding error, and over one year it is. Held for forty years it compounds too: the account that credits every instant ends up 13% larger than the one that credits once a year, off the exact same headline 8%.
The same trick runs backwards against you. A credit card that advertises 22% is quoting the rate before its monthly crediting. Credit it monthly, the way cards actually do, and the effective rate is 24.36%, more than two points above the sticker.
The same number, but prices moved too
Say an account really does earn its 8%, or a more typical 7%. What you can spend with it is a second question, because prices are growing at the same time. $100,000 earning 7% for thirty years becomes $761,226. Over those same thirty years, at 3% inflation, the price of everything you’d buy with that money also grows, by a factor of 2.43.
Divide one by the other and that $761,226 buys what $313,615 buys today. Less than half of what the statement shows. Nobody stole anything and no year went badly; the number on the account and the number of things it can buy are two different questions, and the second one is the real return, real meaning “after prices moved.”
A 1% fee, and where the other 24% of your money went
A management fee of 1% a year sounds like it should cost about 1% of your final balance, or maybe 30% if you just multiply it by thirty years. It costs neither. Run a $100,000 account at 7% for thirty years with a 1% fee taken out every year, and you keep 75.45% of what the fee-free account would have made. You lose 24.55%, not 1% and not 30%.
Here is where that missing quarter actually went. Over those thirty years the fee itself only ever billed $83,557 in total. But the final shortfall, compared to the no-fee account, is $198,147. The extra $114,590 was never charged to anyone. It’s the growth that the $83,557 would have earned, had it stayed in the account instead of leaving every year. Every dollar that exits a compounding account takes its whole future with it: a dollar that leaves in year one loses forty years of doubling, a dollar that leaves in year thirty loses almost none. That whole effect, a small fee costing far more than its own size, has a name: fee drag.
The average return is not the return you get
Here is the strangest one. Say an account loses 50% one year, then gains 100% the next. Average those two numbers the ordinary way and you get plus 25% a year, a great-looking result. Now do the actual arithmetic instead: half your money, then double what’s left, and you are back to exactly where you started. Zero.
The number that quotes the average of a run of returns is answering a different question than the one you actually asked. The honest answer, the constant single rate that would have produced the same ending money, is the geometric mean, and for that −50%-then-+100% run it is exactly 0%, matching what really happened. The two only agree when every year is identical, and the wilder the swings, the further apart they drift. That is also why a return quoted as an average, across many people or many years, can be perfectly true and still be nothing like what any one person actually lived through: the average gets pulled up by the rare spectacular run, and the typical result sits well below it.
Same average, different order, wildly different ending
Multiplication doesn’t care what order it happens in, as long as nothing else is moving. Run three bad years then seven good ones, or the same seven good years first and the three bad ones last, and an account nobody touches ends at the identical number either way.
Add a withdrawal and that stops being true. Take a million dollars, the same ten years of returns, and pull $60,000 out at the start of every year. Hit the three bad years first and you end with $800,471. Hit those same three bad years last, after the good years already grew the account, and you end with $1,498,221. Same ten returns, same average both ways, and the two endings differ by nearly double. The reason has a name, sequence risk: money withdrawn during a bad year is money that never gets to sit through the recovery.
flowchart TB
  S["$1,000,000 to start, same 10 returns either way"] --> P1["bad years arrive first"]
  S --> P2["good years arrive first"]
  P1 -->|"$60,000 taken out every year"| E1["ends at $800,471"]
  P2 -->|"$60,000 taken out every year"| E2["ends at $1,498,221"]
It runs exactly backwards for somebody still putting money in instead of taking it out. They want the bad years first, because their early, cheaper contributions are the ones still growing once the good years arrive.
You now know
- A stated interest rate isn’t one number: how often it compounds, what inflation does to it, what’s taken as a fee, and what order the good and bad years land in all change what you actually get.
- Compounding a rate more and more often doesn’t send it to infinity. It creeps up on a fixed wall, the number
e, 2.71828… - A 1% yearly fee doesn’t cost 1% of your final balance over thirty years. It costs about a quarter of it, because the fee pulls money out of an account before that money can keep growing.
- The average of a run of returns is not the return you get: −50% then +100% averages to +25% a year on paper and 0% in the account.
- Two savers with the exact same average return can end up with nearly double one another, purely from which years the good and bad ones happened to land in.
- The same arithmetic runs backwards on a credit card: a “22%” rate is really 24.36%, because it compounds monthly too.
Stop here if you want. What follows is the same six adjustments, worked out with the actual formulas and numbers behind them.
Second read: the six adjustments, in numbers
The rate is a number and a frequency. The effective annual rate for a nominal rate r compounded n times a year is (1 + r/n)ⁿ − 1, and its limit as n → ∞ is eʳ − 1 - Bernoulli’s wall, generalised to any rate. At a nominal 8%:
| compounding | effective annual rate |
|---|---|
| annual | 8.000000% |
| semi-annual | 8.160000% |
| quarterly | 8.243216% |
| monthly | 8.299951% |
| daily | 8.327757% |
continuous (e^0.08 − 1) | 8.328707% |
The gap between the annual row and the continuous row is approximately r²/2: 0.32pp at 8% against the true 0.3287pp. It’s small because it’s quadratic in r, which is also why it stops being small once r isn’t: at a credit card’s 22%, the same gap is 2.61pp, which is the whole reason the debt section below looks so much worse than the savings section above. Compounding frequency also saturates fast - monthly captures 0.30 of the available 0.33-point gap, so “compounded daily” is worth roughly a thousandth of a percentage point over monthly.
Inflation divides; it does not subtract. Money grows by (1 + r) and prices grow by (1 + i), so purchasing power grows by the ratio of the two, not the difference:
1 + r_real = (1 + r_nominal) / (1 + i)

r_real = (r_nominal − i) / (1 + i)
At a nominal 7% with 3% inflation, the naive subtraction says 4%. The honest ratio says:
1.07 / 1.03 − 1 = 3.883495%The subtraction’s error is i × r_real, small while i is small - but at 10% inflation a 7% nominal return is 1.07/1.10 − 1 = −2.727% real, not the naive −3%, and the correction flips sign once the real return itself goes negative. The figure that lands hardest is the level, not the rate: $100,000 at 7% nominal for 30 years is $761,226, prices multiply by 1.03³⁰ = 2.4273, so the purchasing power is 761,226 / 2.4273 = $313,615 - 41% of the nominal number, nominal and real being two different questions about the same balance.
Fee drag, computed honestly. A fee f against a gross return g keeps this fraction of the no-fee balance, every year compounding on itself:
fraction kept  =  ((1 + g − f) / (1 + g))ᵗ
fraction lost  =  1 − that
At g = 7%, f = 1%: 1.06/1.07 = 0.990654 a year, itself a compounding process running at −0.935% a year:
| years | gross | net of 1% | you keep | you lose |
|---|---|---|---|---|
| 10 | 1.9672× | 1.7908× | 91.04% | 8.96% |
| 20 | 3.8697× | 3.2071× | 82.88% | 17.12% |
| 30 | 7.6123× | 5.7435× | 75.45% | 24.55% |
| 40 | 14.9745× | 10.2857× | 68.69% | 31.31% |
A 1% fee has a halving time: ln(0.5) / ln(0.990654) = 73.8 years. A 2% fee halves you in 36.7 years, which fits inside a working life. Simulated explicitly rather than by formula - $100,000, 7% growth, 1% of the balance deducted each year:
total fees actually billed over 30 years   $ 83,557
final balance                              $563,079
gross balance had the fee never existed    $761,226
shortfall                                  $198,147
Billed $83,557, cost $198,147 - a factor of 2.37. The extra $114,590 is the growth of the fees themselves, compounding in someone else’s account instead of yours after they left early.
The arithmetic of losses, and the average you actually live. A fall of d needs a gain of d/(1−d) to get back to level, and the relationship is not symmetric:
| fall | gain needed to recover |
|---|---|
| −10% | +11.11% |
| −20% | +25.00% |
| −30% | +42.86% |
| −50% | +100.00% |
| −60% | +150.00% |
| −80% | +400.00% |
| −90% | +900.00% |
That asymmetry is why the arithmetic mean is the wrong summary of a return series, and the geometric mean is the right one:
g = (Π(1 + rᵢ))^(1/n) − 1In words: the constant single rate that would have produced the same ending wealth as the whole sequence. For a ten-year run of three −15% years then seven +20% years:
arithmetic mean      9.5000%
σ (of those returns) 0.1604   →  σ²/2 = 1.2862%
9.5% − 1.2862%    =  8.2138%
true geometric    =  8.2063%    ← the approximation is off by 0.007pp
geometric ≈ arithmetic − σ²/2 is the shortcut, called volatility drag: on $1,000,000, that’s a believed $2,478,228 against an actual $2,200,521.
Why the average and the typical outcome pull apart. Wealth after T periods is a product of T random factors, so its logarithm is a sum, and the sum is what the bell curve actually applies to. Wealth itself ends up log-normal, and a log-normal’s mean and median are different numbers:
median wealth =  e^(mT)
mean   wealth =  e^(mT + s²T/2)          ← strictly larger, for any s > 0
At an 8% arithmetic mean with 18% volatility, over 30 years:
| horizon | mean outcome | median outcome | mean/median | share of paths finishing below the mean |
|---|---|---|---|---|
| 10 yr | 2.159× | 1.836× | 1.176 | 61.20% |
| 20 yr | 4.661× | 3.371× | 1.383 | 65.63% |
| 30 yr | 10.063× | 6.189× | 1.626 | 68.90% |
| 40 yr | 21.725× | 11.364× | 1.912 | 71.54% |
At 30 years the average outcome is 63% larger than the typical one, and roughly 69% of paths finish below the average. The extreme version: a coin that pays +50% on heads and −40% on tails has an arithmetic mean of +5% a flip, positive by a mile, and an expected wealth after 100 flips of 1.05¹⁰⁰ = 131.5×. But the geometric mean per flip is √(1.5 × 0.6) − 1 = −5.13%, and the median outcome over 100 flips, 50 heads and 50 tails, is 0.9⁵⁰ = 0.00515 - down 99.5%. Both numbers are correct at once. The expectation is real, and it’s carried almost entirely by the vanishingly rare run of mostly-heads paths; the typical path is ruined.
Sequence-of-returns risk. With no money entering or leaving, order cannot matter, because multiplication commutes. Add a flow and it can:
| ordering | arithmetic mean | geometric mean | no withdrawals | withdrawing $60k/yr |
|---|---|---|---|---|
| bad years first | 9.50% | 8.2063% | $2,200,521 | $800,471 |
| good years first | 9.50% | 8.2063% | $2,200,521 | $1,498,221 |
Same returns, same averages by every measure, and the ending balances differ by 1.87×, purely from the order the identical returns arrived in - a withdrawal is a fixed amount against a variable base, so it removes a larger share of the account in a bad year, and those shares are absent for the recovery. It runs exactly backwards for a contributor, same sequences, $60,000 added each year instead of withdrawn:
bad years first   →  $1,400,049
good years first  →  $  702,300
The saver wants the bad years early; the retiree wants them late. Sequence risk has no sign of its own until you say which way the money is flowing.
The debt side: the same formula, pointed the other way. A credit card’s APR is a nominal rate compounded monthly, and that stops being a technicality once the rate is large:
effective annual rate = (1 + 0.22/12)¹² − 1 = 24.3597%2.36 percentage points above the quoted 22%, doubling in ln 2 / ln(1.243597) = 3.18 years. Minimum payments are defined as a fraction of the balance, so they shrink exactly as fast as the balance does: on a $5,000 balance, a $100-a-month fixed payment takes 11.4 years and $8,678 in interest, a $250-a-month payment takes 2.1 years and $1,285 - 2.5× the payment for 5.5× less interest, because the extra money is applied while the balance, and the interest it’s charged on, is still large. The amortisation formula holds the whole cliff in it:
n = −ln(1 − r·P/A) / ln(1 + r)In words: the number of months to pay off principal P at monthly rate r with payment A. As A approaches r·P - here, $5,000 × 1.8333% = $91.67 a month - the logarithm’s argument goes to zero and n → ∞. Pay $92 and you converge, eventually. Pay $91.67, one dollar less, and you never pay it off at all, at any horizon, having paid an unbounded amount along the way.
The board’s hockey stick, corrected. Every decade of the 8%, forty-year curve multiplies by the identical 1.08¹⁰ = 2.1589, not an accelerating one: $10,000 → $21,589 → $46,610 → $100,627 → $217,245. The last decade adds $116,619, which is 54% of the finish, not because the late years work harder but because they start from the largest number already built by the ones before them. The correct statement is the opposite of “the early years do nothing”: the first decade’s output is exactly what every later decade multiplies.
None of this is advice, and none of it runs forever unexamined. An “8% average” is one century’s realised path through markets that survived to be measured - the ones that went to zero left the sample, taking the very returns you’d most want in the average with them - not a promise about the next one, and the same “flat at first, explosive later” illusion that misreads the hockey stick misreads a market history too.
Try it
No code? Do this. Twenty minutes, a pencil and the calculator on your phone. Turning the phone sideways usually gives a calculator with an xʸ (power) button; without one, multiply by the same number repeatedly.
- Redo Bernoulli. Credit 100% four times a year: each credit multiplies the balance by 1.25. Multiply 1.25 by itself four times. Does it match the story’s $2.44?
- The rule of 72. Bankers say money at 8% doubles in 72 ÷ 8 = 9 years. Multiply 1.08 by itself nine times and see how close it lands to 2.
- The average that lies. Start with 100. Lose 20%, then gain 20%. Where do you end up? The “average return” of those two years is 0%. What was the real one?
- The fee, on your phone. Work out 1.07 to the power 30 (seven percent for thirty years, no fee) and 1.06 to the power 30 (the same, with a 1% fee). Divide the second by the first. What share of the money does the fee leave you?
- Your own sticker rate. Find the interest rate on a card, a loan or a savings account you hold. If it is credited monthly, divide the yearly rate by 12, add 1, and raise to the 12th power. Try it on the story’s “22%” card first.
Answers
1. 1.25 × 1.25 = 1.5625, × 1.25 = 1.953, × 1.25 = 2.441. Yes: $2.44.
2. 1.08 to the ninth power is 1.999. The rule of 72 is almost exact at 8%.
3. 100 becomes 80, then 80 × 1.2 = 96. You lost 4%, although the two returns “average” to zero. Swings cost you even when they balance on paper.
4. 1.07³⁰ is about 7.61 and 1.06³⁰ about 5.74. 5.74 ÷ 7.61 is about 0.755: the fee leaves you 75.5% and takes the other 24.5%, the story’s quarter.
5. For the 22% card: 0.22 ÷ 12 = 0.01833, so the monthly multiplier is 1.01833, and 1.01833¹² is about 1.2436: an effective 24.36%, as in the story.
With Python, the block below runs every number in the lesson, including the sequence-of-returns comparison.
import math, statistics

# --- 1. the rate is a number AND a frequency -----------------------------
r = 0.08
for n in (1, 2, 4, 12, 365):
    print(f"n={n:>3}  effective {(1 + r/n)**n - 1:.6%}")
print("continuous:", f"{math.exp(r) - 1:.6%}", " gap ~ r^2/2 =", f"{r*r/2:.4%}")
for T in (10, 20, 30, 40):
    print(T, f"1.08^T {1.08**T:7.4f}  e^(.08T) {math.exp(.08*T):7.4f}  +{math.exp(.08*T)/1.08**T - 1:.2%}")
# 40 yr: 21.7245 vs 24.5325 -> +12.93% from a third of a percentage point

# --- 2. inflation divides ------------------------------------------------
real = 1.07/1.03 - 1                       # 3.883495%, NOT 4%
print("real:", f"{real:.6%}", " naive 4% overstates 30y by",
      f"{1.04**30/(1+real)**30 - 1:.2%}")
print("purchasing power of 100k @7% for 30y:", f"{100_000*1.07**30/1.03**30:,.0f}")
# $313,615 -- 41% of the $761,226 nominal

# --- 3. fee drag ---------------------------------------------------------
keep = lambda g, f, T: ((1+g-f)/(1+g))**T
for T in (10, 20, 30, 40):
    print(T, f"keep {keep(.07,.01,T):.2%}  lose {1-keep(.07,.01,T):.2%}")
print("halving time of a 1% fee:", f"{math.log(.5)/math.log(1.06/1.07):.1f} yr")
bal, fees = 100_000.0, 0.0                 # deduct 1% of assets, explicitly
for _ in range(30):
    bal *= 1.07; fee = bal*0.01; fees += fee; bal -= fee
print(f"billed {fees:,.0f}  final {bal:,.0f}  shortfall {100_000*1.07**30-bal:,.0f}"
      f"  ratio {(100_000*1.07**30-bal)/fees:.2f}")
# billed 83,557 -- cost 198,147. The difference is the growth of money that left.

# --- 4. losses, and the average you live ---------------------------------
for d in (.1,.2,.3,.5,.9): print(f"-{d:.0%} needs +{1/(1-d)-1:.2%}")
seq = [-.15]*3 + [.20]*7
p = math.prod(1+x for x in seq)
sd = statistics.pstdev(seq)
print("arith", f"{sum(seq)/10:.4%}", " geo", f"{p**.1 - 1:.4%}",
      " arith - sig^2/2", f"{sum(seq)/10 - sd**2/2:.4%}")   # 8.2138% vs true 8.2063%

# --- 5. mean vs median: you get ONE path ---------------------------------
mu, sig = 0.08, 0.18
m = math.log(1+mu) - sig**2/2
Phi = lambda x: 0.5*(1 + math.erf(x/math.sqrt(2)))
for T in (10, 20, 30, 40):
    print(T, f"mean {(1+mu)**T:6.3f}  median {math.exp(m*T):6.3f}"
             f"  ratio {(1+mu)**T/math.exp(m*T):.3f}  below mean {Phi(sig*math.sqrt(T)/2):.2%}")
print("coin +50/-40: E[100 flips]", f"{1.05**100:,.1f}x",
      " median", f"{0.9**50:.5f}x")        # 131.5x expected, -99.5% typical

# --- 6. sequence risk: order is free until money moves -------------------
def run(start, flow, seq):                 # flow < 0 withdraws, > 0 contributes
    b = start
    for x in seq: b = (b + flow) * (1 + x)
    return b
for name, s in (("bad first", seq), ("good first", seq[::-1])):
    print(f"{name:11} no flows {run(1e6,0,s):>12,.0f}"
          f"   -60k/yr {run(1e6,-60_000,s):>12,.0f}"
          f"   +60k/yr {run(0,60_000,s):>12,.0f}")
# no flows: identical. withdrawing: 800,471 vs 1,498,221. contributing: reversed.

# --- 7. the debt side ----------------------------------------------------
apr = 0.22; mr = apr/12
print("EAR", f"{(1+mr)**12 - 1:.4%}", " doubles in",
      f"{math.log(2)/math.log((1+mr)**12):.2f} yr")
for A in (100, 150, 200, 250):
    n = -math.log(1 - mr*5000/A)/math.log(1+mr)
    print(f"${A}/mo -> {n:5.1f} months, interest ${n*A - 5000:,.0f}")
print("interest-only cliff at $", f"{5000*mr:.2f}", "/month -- below it, never")
bal, paid, mth = 5000.0, 0.0, 0            # 2%-of-balance minimum, $25 floor
while bal > 0.005 and mth < 1200:
    bal += bal*mr; pay = min(max(bal*0.02, 25), bal); bal -= pay; paid += pay; mth += 1
print(f"2% minimum: {mth} months ({mth/12:.1f} yr), paid ${paid:,.0f}")

# --- 8. board check: every decade does the same work ---------------------
prev = 10_000
for d in range(1, 5):
    v = 10_000*1.08**(10*d)
    print(f"decade {d}: {prev:>9,.0f} -> {v:>9,.0f}  gain {v-prev:>9,.0f}  x{v/prev:.4f}")
    prev = v
Run block 6 and watch the first column print the same number twice and the next two columns disagree by a factor of two in opposite directions. Every summary statistic of those two runs is identical, same returns, same arithmetic mean, same geometric mean, same volatility, and the answers differ by 87%. That is the sharpest available demonstration that a compounding process is not summarised by its average.
Related
Fold a Paper to the Moon (the same doubling curve with no rate, no fee and no inflation attached) · The 99 Percent Test That Is Usually Wrong (the other lesson where the number everyone quotes is not the number that matters) · Mental Models & Decision-Making (thinking about thinking) and Decision-Making Under Uncertainty (what to do once you have a distribution instead of a single point) · Cognitive Biases (the related failure modes in how people read a quoted average). The full Mind Blown list is in CURRICULUM.
Go deeper
- Effective interest rate and compounding conventions
- Fisher equation - why real returns divide rather than subtract
- Geometric mean vs arithmetic mean of returns
- Volatility tax / variance drain (σ²/2)
- Log-normal distribution - mean, median and mode
- Ergodicity economics - Peters, “The ergodicity problem in economics”, Nature Physics 15 (2019)
- Kelly criterion - maximising the geometric, not arithmetic, mean
- Sequence risk
- Amortization calculation and the interest-only threshold
- Survivorship bias in financial data
- Jacob Bernoulli and the discovery of e.
Retrieval practice
8 questions. Answer each one before you open it.
What does a 1% annual fee actually cost over 30 years, and why is it not simply 1%?
The kept fraction is ((1 + g − f)/(1 + g))ᵗ. At a 7% gross return and a 1% fee, that ratio is 1.06/1.07 = 0.990654 per year - itself a compounding process running at −0.935% a year. Over 30 years you keep 75.45% and lose 24.55% of the final balance; over 40 years you lose 31.31%. On $100,000 that’s $761,226 gross versus $574,349 net - $186,876 gone. The clean way to hold it: a 1% fee has a halving time of 73.8 years (ln 0.5 / ln 0.990654), and a 2% fee halves you in 36.7 years, which fits inside a working life. It isn’t 1% because the fee isn’t deducted once at the end; it’s deducted every year from the base that everything after it multiplies. Simulated explicitly: over 30 years you’re billed $83,557 in fees and it costs you $198,147 - a factor of 2.37. The extra $114,590 is the compounding of money that left early.
Why is the geometric mean the honest average of a run of returns, and the arithmetic mean not?
Because returns are multiplied, not added, so the summary you want is the constant rate producing the same ending wealth: g = (Π(1 + rᵢ))^(1/n) − 1. The arithmetic mean answers a different question, the return of one average year, which never occurs. The demonstration: −50% then +100% has an arithmetic mean of +25% a year while 0.5 × 2 = 1.0, so you’re exactly where you started and the true annualised return is 0%. +50% then −50% averages 0% arithmetically and is −13.40% geometrically - you hold 0.75 after two years. The gap is volatility drag, geometric ≈ arithmetic − σ²/2: on a ten-year sequence of three −15% years then seven +20% years, arithmetic is 9.5000%, σ = 0.1604 so σ²/2 = 1.2862%, and 9.5 − 1.2862 = 8.2138% against a true geometric of 8.2063%, off by 0.007pp. On $1,000,000 that’s a believed $2,478,228 against an actual $2,200,521. The two means are equal only when every return is identical.
Convert a 7% nominal return at 3% inflation to a real return, and say why subtraction is wrong.
Money grows by (1+r) and prices grow by (1+i), so purchasing power grows by the ratio, not the difference: 1.07/1.03 − 1 = 3.883495%, not 4%. The general form is r_real = (r_nominal − i)/(1 + i), so the subtraction’s error is i × r_real, small while i is small, because the denominator sits near 1. It stops being small when inflation isn’t: at 10% inflation a 7% nominal return is 1.07/1.10 − 1 = −2.727% real, not −3%, and the correction flips sign once the real return goes negative. The figure that lands hardest is the level: $100,000 at 7% for 30 years is $761,226 nominal, prices multiply by 1.03³⁰ = 2.4273, so it buys $313,615 - 41% of the nominal number.
Why is expected value the wrong statistic for a single saver, and by how much do the mean and median diverge?
Because wealth is a product of random factors, so its log is a sum and the bell curve applies there - wealth ends up approximately log-normal, and a log-normal’s mean and median differ. With log-return N(m, s²), after T periods median = e^(mT) while mean = e^(mT + s²T/2); the mean exceeds the median by e^(s²T/2) for any s > 0. At an 8% arithmetic mean with 18% volatility over 30 years: mean 10.06×, median 6.19×, ratio 1.63, and the share of paths finishing below the mean is 68.9%. The mean is a correct statement about an ensemble, carried by a few spectacular paths; you get one draw. The extreme case: a coin paying +50%/−40% has an arithmetic mean of +5% per flip and an expected wealth of 1.05¹⁰⁰ = 131.5× after 100 flips, while the geometric mean is √(1.5 × 0.6) − 1 = −5.13% and the median outcome, 50 heads and 50 tails, is 0.9⁵⁰ = 0.00515 - down 99.5%. Positive expected value and near-certain individual loss, at the same time, and the expectation gives no warning of it.
Sequence risk: when does the order of returns matter, when doesn’t it, and which direction does it cut?
With no flows it cannot matter: multiplication commutes, so the same ten returns in either order give the identical $2,200,521 from $1,000,000. Add a withdrawal and it matters enormously: $60,000 taken out at the start of each year gives $800,471 with the bad years first and $1,498,221 with the good years first, a 1.87× difference from ordering alone, with identical arithmetic means (9.50%), identical geometric means (8.2063%) and identical volatility. The mechanism is mechanical, not statistical: a withdrawal is a fixed amount against a variable base, so in a bad year it removes a larger fraction, and those units are absent for the recovery. It reverses for a contributor: the same sequences with $60,000 added each year give $1,400,049 bad-years-first and $702,300 good-years-first. Sequence risk has no sign until you say which way the money is flowing: the saver wants the bad years early, the withdrawer wants them late.
Why is a credit card’s 22% APR not actually 22%, and what does the minimum payment actually do?
APR is a nominal rate compounded monthly: 0.22/12 = 1.8333% a month, so the effective annual rate is (1 + 0.22/12)¹² − 1 = 24.3597%, 2.36 percentage points above the quote. The gap between a nominal and a continuously-compounded rate is roughly r²/2, which is 0.33pp at 8% and large at 22% precisely because it’s quadratic. Doubling time at the true rate is 3.18 years. On a $5,000 balance, minimum payments defined as a fraction of the balance shrink with the balance, so a fixed $100-a-month payment takes 11.4 years and $8,678 in interest, while $250 a month takes 2.1 years and $1,285, 2.5× the payment for 5.5× less interest and 5.4× less time. The amortisation formula n = −ln(1 − r·P/A)/ln(1+r) has a hard threshold built in: as the payment A approaches r·P, here $91.67 a month, the number of months goes to infinity. Pay $92 and you converge, eventually; pay $91.67 and you never pay it off, at any horizon.
Why does compounding frequency stop mattering, and what is the exact relationship between (1 + r/n)ⁿ and eʳ?
(1 + r/n)^(nt) → e^(rt) as n → ∞; continuous compounding is that limit, the same wall Jacob Bernoulli found in 1683, not a different model. At a nominal 8% the effective annual rates are 8.000000% annual, 8.160000% semi-annual, 8.243216% quarterly, 8.299951% monthly, 8.327757% daily and 8.328707% continuous. The entire span from annual to continuous is 0.329pp, approximately r²/2 = 0.32pp, and monthly already captures 0.30 of those 0.33 points, so “compounded daily” is worth about a thousandth of a percentage point over monthly. Being quadratic, the gap is negligible at 8% and is 2.61pp at 22%. Compounded over a horizon it stops being decorative: over 40 years e^(0.08×40) = 24.53× against 1.08⁴⁰ = 21.72×, +12.93%.
The board’s hockey stick looks like the last decade “does almost everything.” Why is that wrong, and what’s the correct statement?
Every decade multiplies by the identical factor 1.08¹⁰ = 2.1589. From $10,000: decade 1 gains $11,589 (to $21,589), decade 2 gains $25,020 (to $46,610), decade 3 gains $54,017 (to $100,627), decade 4 gains $116,619 (to $217,245), same factor, growing increments. The last decade contributes 53.68% of the final balance in absolute dollars and does no more proportional work than any other. It only looks flat early because a linear axis hides that; on a log axis the curve is a straight line with no flat part at all. The correction matters because the false version implies the early years are dispensable, when the true one says the opposite: every decade multiplies by the same factor; the last one is the largest only because it starts from the largest number, the one every earlier decade built.